Wingspan Lab Results
For the Wingspan Lab, my class and I measured our wingspans and our heights. The purpose of this lab is to compare the two measurements and make a graph to show said comparison. I learned that our height and wingspan are very similar and sometimes the same. I was also able to learn how to properly display the data in an organized fashion to make it easy to analyze.
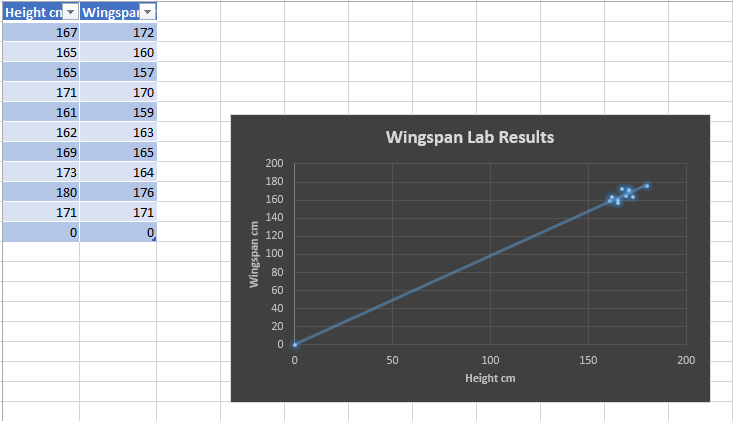
1. After looking at the data, I noticed some patterns. For one, the graph has a
positive correlation, meaning that, as the height grows, the wingspan grows as well.
Also, the wingspan tends to be smaller than the height. There are, of course, a few exceptions to this.
2. My line of best
fit crosses the y axis at 0. This means that if you have zero height, you have
zero wingspan.
3. You would expect the line to cross at the origin. You
would expect the line to cross here because, logically, if you do not have a
wingspan, you wouldn’t have a height either.
4. You could look at where
their height is on the graph and follow that number up to where the line is and
then look over it what number it corresponds with on the y-axis.
5. I predict that a person with a height of 91 cm, would have a wingspan of around 89 cm.
